Git Stats
I wanted to see a quick graph of a larger project I was working on for a retrospective with the team, I wrote a quick script to do it. Hopefully it’s useful to someone else.
Getting The Statistics
There is a great library for getting the lines of code from a git repository called Tokei, however this is only for the current state of the repository. So lets loop over the history of the repository and get the stats for each commit.
branch=develop

# make directory at location of script
mkdir -p $(dirname $0)/working

echo "WARNING: This will delete any working files in the working directory"
read -p "Press enter to continue"

# Loop over commits
for commit in $(git rev-list $branch)
do
  # check out the commit - force checkout
  git checkout -f $commit

  # Output progress
  date=$(git show -s --format=%ci $commit | cut -d' ' -f1,2 | sed 's/ /T/')
  echo $commit $date

  # run tokei and save output to file in working directory
  tokei --output json > $(dirname $0)/working/$date-$commit.json
done

# put repo back to head of branch selected
git checkout $branch
Parsing The Data
Next we need to loop over the generated stats and drop them into a useful format for Chart js. I’m using TypeScript for this, but it could easily be done in JavaScript.
import fs from 'fs';
import path from 'path';

type TTokeiFile = Record<
  string,
  {
    comments: number;
    blanks: number;
    code: number;
  }
>;
type timeseriesOutput = {
  date: string;
  languages: Record<
    string,
    {
      comments: number;
      blanks: number;
      code: number;
    }
  >;
};
type output = {
  languages: Array<string>;
  timeseries: Array<timeseriesOutput>;
  dates: Array<string>;
  dataCode: Record<string, Array<number>>;
  dataComments: Record<string, Array<number>>;
  dataBlanks: Record<string, Array<number>>;
};

// output dist directory
const outDir = path.join(__dirname, 'dist');
if (!fs.existsSync(outDir)) {
  fs.mkdirSync(outDir);
}

// Read out the files in the working directory
const workingDir = path.join(__dirname, 'working');
const files = fs.readdirSync(workingDir);
files.sort().reverse();

// loop through files and get last file for each date
// file format is: 2023-06-04T12:04:27-7e42aebc55d6689fb9f5b1cd09804cc82fad41dd.json

const filesByDate = new Map<string, string>();
for (const file of files) {
  const date = file.split('T')[0];
  if (!date) {
    continue;
  }

  const existing = filesByDate.get(date);
  if (!existing) {
    filesByDate.set(date, file);
  }
}

const fileListReduced = Array.from(filesByDate.values());
fileListReduced.sort();

const out = {
  languages: [],
  timeseries: [],
  dates: [],
  dataCode: {},
  dataComments: {},
  dataBlanks: {},
} as output;
const outLanguages = new Set<string>();

// Loop through and read each file
for (const file of fileListReduced) {
  const filePath = path.join(workingDir, file);
  const fileContent = fs.readFileSync(filePath, 'utf-8');

  const parsed = JSON.parse(fileContent) as TTokeiFile;
  const date = file.split('T')[0];

  if (!date) continue;

  const languages = Object.keys(parsed);
  languages.forEach(outLanguages.add, outLanguages);

  const record: timeseriesOutput = {
    date,
    languages: {},
  };

  for (const language of languages) {
    if (parsed[language]) {
      record.languages[language] = {
        comments: parsed[language]!.comments,
        blanks: parsed[language]!.blanks,
        code: parsed[language]!.code,
      };
    }
  }

  out.timeseries.push(record);
}

out.languages = Array.from(outLanguages);

// Set the final time series data
// we did not do this on the original loop due to some languages possibly not being present in any given file
out.dates = out.timeseries.map((t) => t.date);

for (const rec of out.timeseries) {
  for (const lang of out.languages) {
    out.dataCode[lang] = out.dataCode[lang] || [];
    out.dataComments[lang] = out.dataComments[lang] || [];
    out.dataBlanks[lang] = out.dataBlanks[lang] || [];

    out.dataCode[lang]!.push(rec.languages[lang]?.code || 0);
    out.dataComments[lang]!.push(rec.languages[lang]?.comments || 0);
    out.dataBlanks[lang]!.push(rec.languages[lang]?.blanks || 0);
  }
}

// output the output file
const outFile = path.join(outDir, 'results.json');
fs.writeFileSync(outFile, JSON.stringify(out, null, 2));
//force copy stats.js and index.html into folder
fs.copyFileSync(
  path.join(__dirname, 'stats.js'),
  path.join(outDir, 'stats.js')
);
fs.copyFileSync(
  path.join(__dirname, 'index.html'),
  path.join(outDir, 'index.html')
);

console.log('Results written to dist folder');
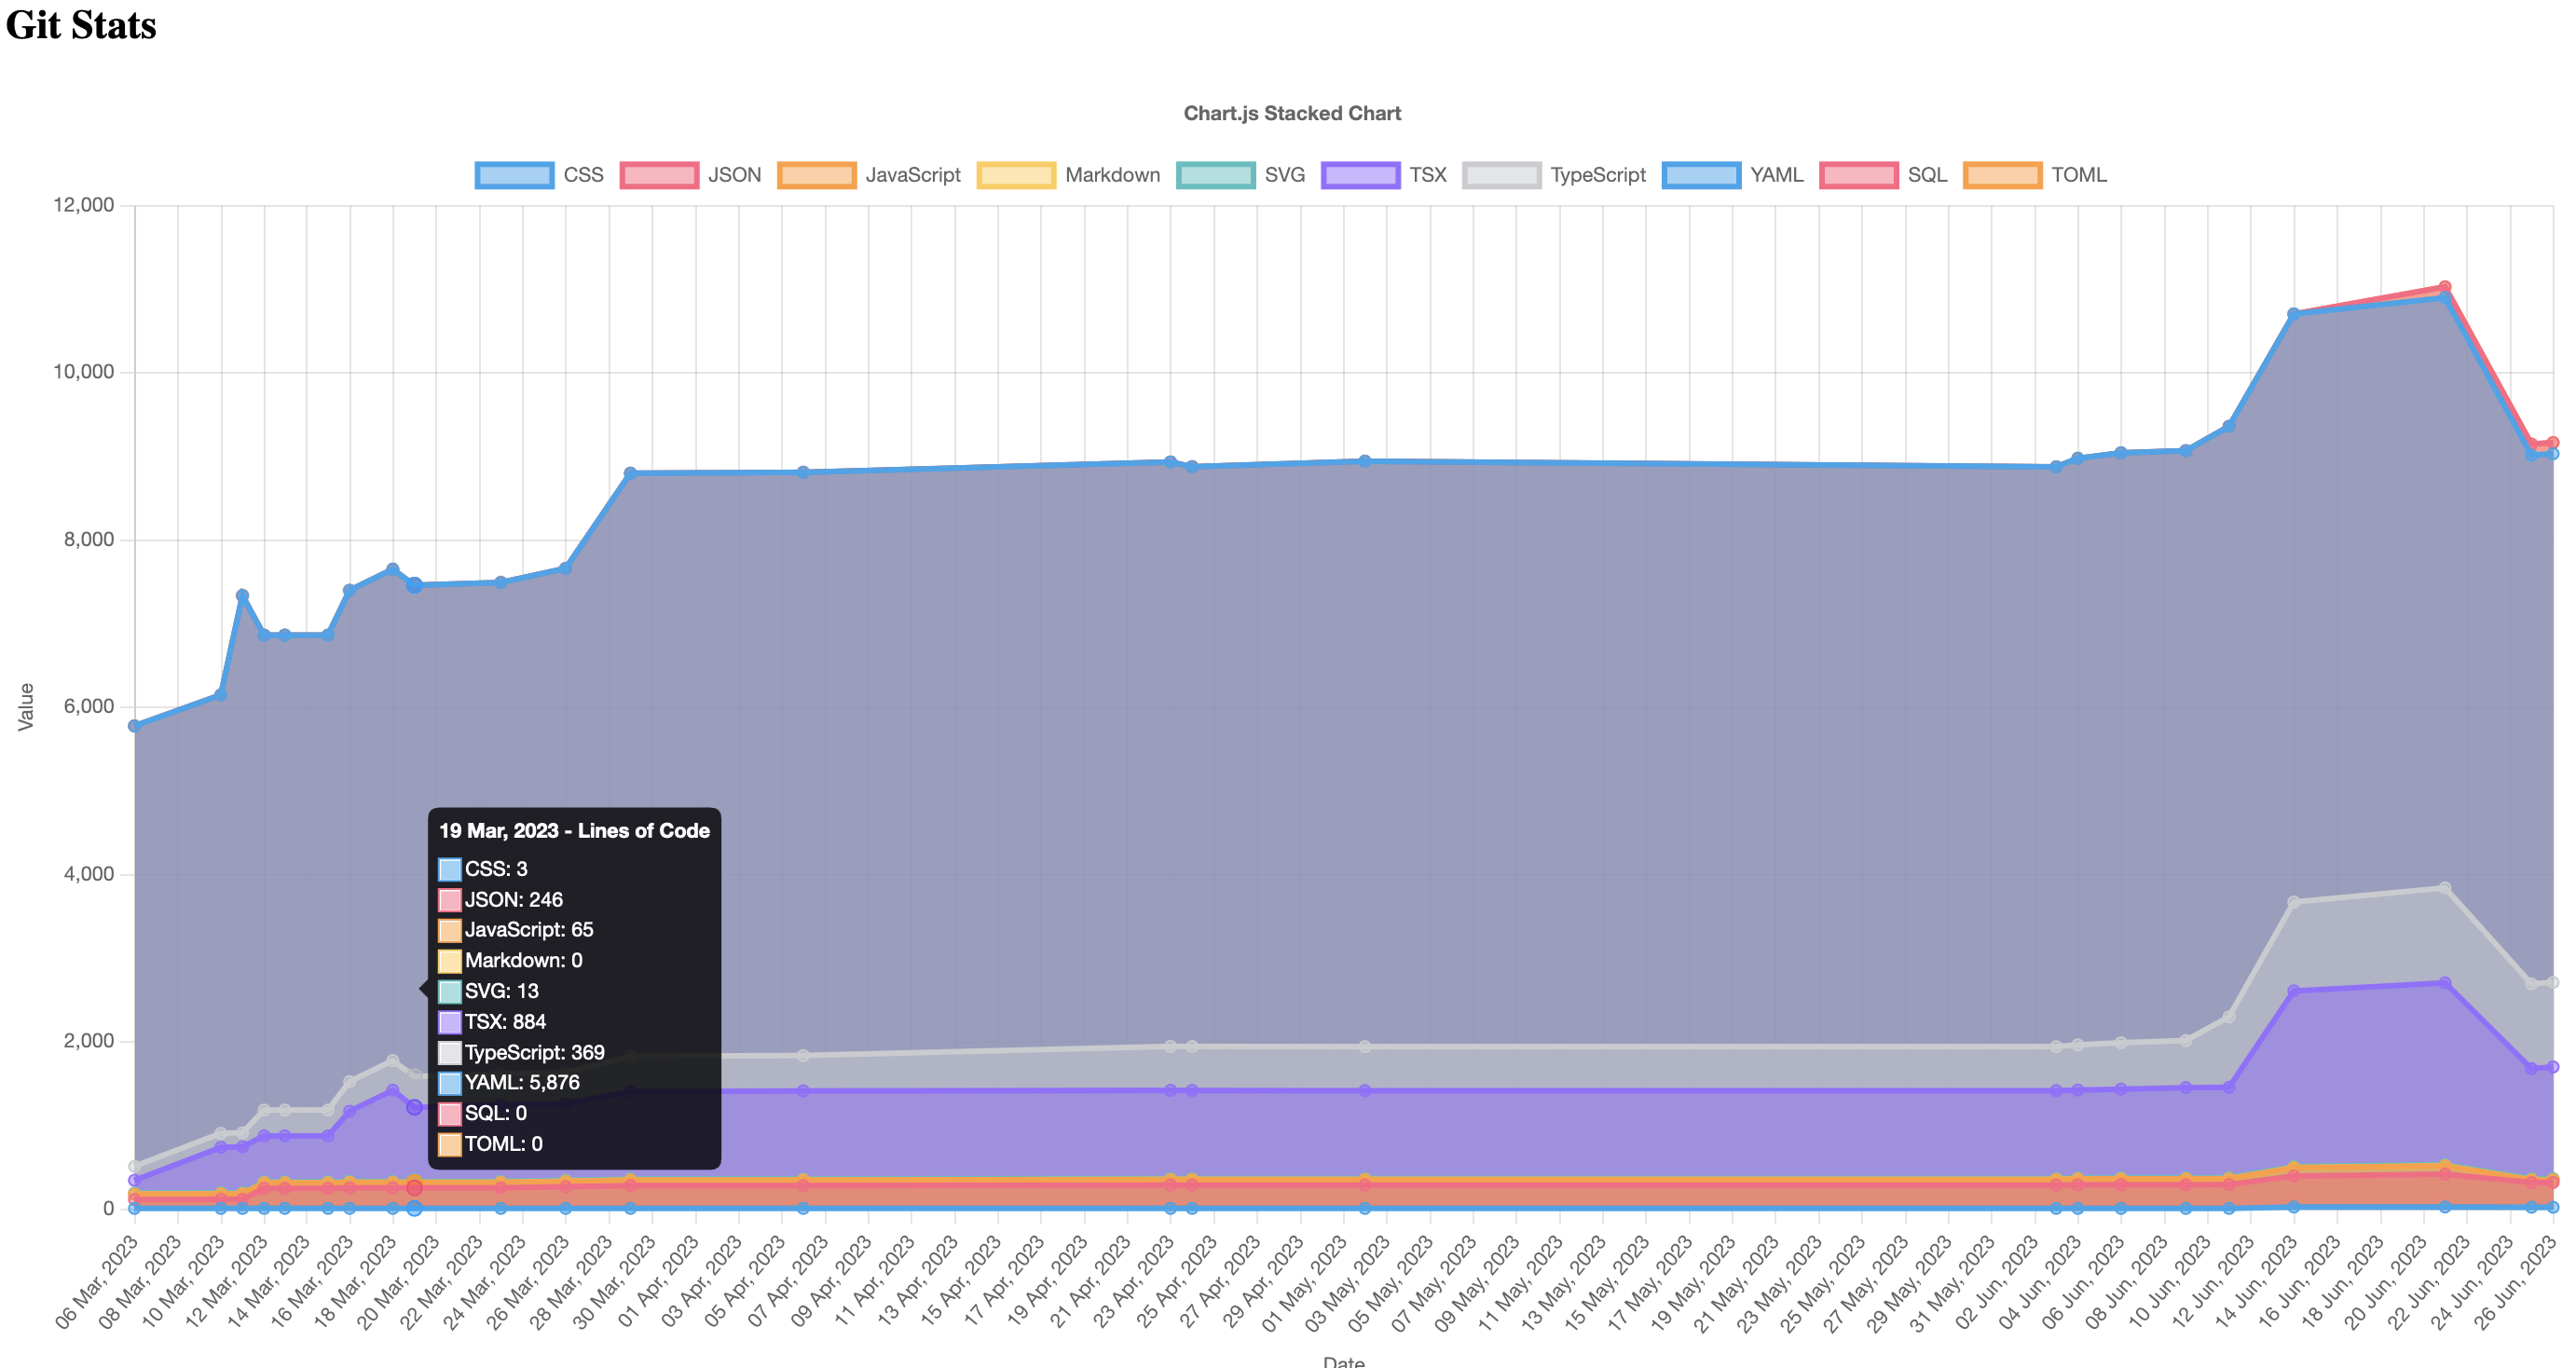
Display
Lets now display this data in a chart. I’m using Chart.js for this, but you could use any charting library you like.
<html>
  <head>
    <title>Results</title>
    <script src="https://cdn.jsdelivr.net/npm/chart.js"></script>
    <script src="https://cdn.jsdelivr.net/npm/dayjs@1/dayjs.min.js"></script>
    <script src="https://cdn.jsdelivr.net/npm/chartjs-adapter-date-fns/dist/chartjs-adapter-date-fns.bundle.min.js"></script>
    <style>
      #chart-continer {
        position: relative;
        width: 100%;
        height: 100%;
        max-height: 700px;
      }
      #chart {
        width: 100%;
      }
    </style>
  </head>
  <body>
    <h2>Git Stats</h2>
    <div id="chart-continer">
      <canvas id="chart"></canvas>
    </div>
    <div id="chart-options">
      <label><input type="checkbox" value="dataCode" checked /> Code</label>
      <label><input type="checkbox" value="dataComments" /> Comments</label>
      <label><input type="checkbox" value="dataBlanks" /> Blank Lines</label>
    </div>
    <script src="stats.js"></script>
  </body>
</html>
And the javascript:
var ctx = document.getElementById('chart').getContext('2d');

let data = null;
let chart = null;

async function setData(incoming) {
  data = await incoming.json();
}

function dataSetParse() {
  const selectedItems = document.querySelectorAll(
    '#chart-options input:checked'
  );

  let dataSet = {};
  if (selectedItems.length > 0) {
    for (const si of selectedItems) {
      // combine with existing data
      for (const ds in data[si.value]) {
        if (!dataSet[ds]) {
          dataSet[ds] = data[si.value][ds];
        } else {
          dataSet[ds] = dataSet[ds].map((v, i) => v + data[si.value][ds][i]);
        }
      }
    }
  } else {
    dataSet = data.dataCode;
  }

  return dataSet;
}

async function updateChart() {
  const dataSet = dataSetParse();

  // update chart data
  for (const line in dataSet) {
    if (line == 'Total') continue;

    //find
    const found = chart.data.datasets.find((ds) => ds.label == line);
    if (found) {
      found.data = dataSet[line];
      continue;
    }

    chart.data.datasets.push({
      label: line,
      //backgroundColor: data.lines[line].color,
      //borderColor: data.lines[line].color,
      data: dataSet[line],
      fill: true,
    });
  }

  chart.update();
}

async function renderChart() {
  // Line data
  const lineData = {
    labels: data.dates,
    datasets: [],
  };

  const dataSet = dataSetParse();

  for (const line in dataSet) {
    if (line == 'Total') continue;
    lineData.datasets.push({
      label: line,
      //backgroundColor: data.lines[line].color,
      //borderColor: data.lines[line].color,
      data: dataSet[line],
      fill: true,
    });
  }

  // Chartjs stacked area chart
  const config = {
    type: 'line',
    data: lineData,
    options: {
      responsive: true,
      maintainAspectRatio: false,
      plugins: {
        title: {
          display: true,
          text: () => 'Chart.js Stacked Chart',
        },
        tooltip: {
          mode: 'index',
          callbacks: {
            title: function (context) {
              const dt = dayjs(context[0].parsed.x).format('DD MMM, YYYY');
              return `${dt} - Lines of Code`;
            },
          },
        },
      },
      interaction: {
        mode: 'nearest',
        axis: 'x',
        intersect: false,
      },
      scales: {
        x: {
          type: 'time',
          time: {
            unit: 'day',
          },
          ticks: {
            callback: (val) => {
              return dayjs(val).format('DD MMM, YYYY');
            },
          },
          title: {
            display: true,
            text: 'Date',
          },
        },
        y: {
          stacked: true,
          title: {
            display: true,
            text: 'Value',
          },
        },
      },
    },
  };

  chart = new Chart(ctx, config);
}

// wait for page to finish render
document.addEventListener('DOMContentLoaded', () => {
  // fetch dist/results.json
  fetch('results.json').then(setData).then(renderChart);

  const options = document.querySelectorAll('#chart-options input');
  options.forEach((option) => {
    option.addEventListener('change', (e) => {
      updateChart();
    });
  });
});
The Code
If you’d like to see the code, it’s available on GitHub, I am adding some additional stats to it as I need them. If needed there is a tag blog-post that will show the code as it was when I wrote this post.